

An application can have dozens of technical metrics in the red and still continue delivering its core service. The opposite can also happen: CPU, memory, and connectivity appear normal, but users cannot complete a critical operation. The goal of actionable alerts for PHP applications is not to detect every anomaly, but to notify when a person must make a specific decision to limit an operational consequence.
Before opening a dashboard, a useful alert answers four questions: what capability is affected, who is affected, since when, and what initial action is safe. If it does not enable a hypothesis to be formed or an intervention to be decided, it is probably diagnostic telemetry, not an on-call alert.
Separate signals, symptoms, and incidents

A signal is an isolated observation: increased connection usage, PHP-FPM process restarts, queue growth, or a slow API response. A symptom expresses observable service degradation: more errors when confirming orders, critical jobs that do not finish within the deadline, or a sustained increase in the latency of a relevant route. An incident is the situation that requires coordination and response because of its actual or foreseeable impact.
This distinction prevents every infrastructure metric from becoming an interruption. For example, transient CPU saturation can be useful for investigating capacity. It should escalate to an alert if it coincides with failed requests or latency that prevents use of a priority function. Likewise, a high number of PHP exceptions deserves attention when it is concentrated in a business operation or affects a relevant proportion of requests, not merely because it exists in the logs.
- Diagnostic signals: disk consumption, process count, cache hits, individual retries, or exception traces.
- Alertable symptoms: unavailability, a sustained failure rate in a critical flow, processing delay, or imminent resource exhaustion with a verifiable effect.
- Incident indicators: user scope, possible data loss or duplication, failure to meet an operational deadline, and the absence of a reasonable manual alternative.
Build a minimal service map
Before setting thresholds, map the path of relevant flows. There is no need to inventory the entire platform: it is enough to represent the paths that deliver value or create risk. A typical PHP application includes the web request, authentication, domain logic, database, cache, queue publishing, asynchronous consumers, and third-party APIs.
For each segment, document what input it receives, what observable result it must produce, what dependency it needs, and how it behaves on failure. A request may respond successfully after queuing a job, even though the final action has not yet been completed. Therefore, monitoring only the HTTP status code of the web layer leaves the team blind to delays or errors in asynchronous processing.
Prioritize by consequences, not components
Classify each flow according to its consequence if it stops: revenue loss, operational non-compliance, data exposure, support blockage, or mere visual degradation. Then identify a measurement that proves the consequence. For user registration, it may be confirmed account creation; for an import, the age of the oldest pending item; for a billing integration, the percentage of operations that end in a recoverable or final state.
It is advisable to maintain synthetic checks outside the PHP process for essential journeys. An internal check may indicate that the process is alive, but not that load balancing, credentials, session storage, and the business path work together.
The four alert families that usually support decisions
Perceived availability measures whether a representative operation can be completed. It can combine a synthetic check with the percentage of successful responses from critical routes. It is more valuable than alerting on an isolated process, although both data points can coexist in diagnostics.
Business errors capture incorrect outcomes that an HTTP status code does not reveal: validations that fail unexpectedly, payments rejected due to an internal change, documents not generated, or impossible state transitions. They should use domain events with identifiers that allow investigation without including unnecessary personal information.
Latency should be measured by route and by percentiles, not only through averages. An acceptable average can hide a minority of excessively slow requests. Alert when latency is sustained and affects a relevant operation; a brief spike may require observation, not waking a person.
Processing delay measures the time from when a job is accepted until it finishes. It is especially important in queues because the total number of messages does not always imply urgency: a large backlog can be normal if consumers drain it within the required deadline.
Define thresholds from the baseline
Do not copy a generic CPU, latency, or queue-size value. Gather a baseline by time slot and load type, including predictable peaks. Then define the level based on impact: how long a flow can take before failing to meet a user expectation, an operational window, or an internal obligation.
A robust rule combines four elements: an evaluation window, minimum persistence, magnitude, and scope. For example, detecting an increase in errors is not enough; establish that the increase persists for several windows and represents a significant fraction of the flow's operations. This reduces notifications caused by transient deployments, successful retries, or isolated anomalous traffic.
Distinguish the deployment, which installs a version, from the release, which enables a behavior change for users. Both are relevant context, but they are not equivalent. An alert after a deployment may guide a rollback or technical investigation; an alert after a gradual rollout may require stopping exposure of the change before rolling back code.
Queues, databases, and external integrations
Queues: monitor age and effective capacity
For each critical queue, measure the age of the oldest pending job, the arrival rate, the completion rate, permanent failures, and retries. Add signals about available consumers and execution duration. The most actionable alert is usually based on age: it directly relates the delay to the flow's commitment.
Queue growth is diagnostic until it exceeds draining capacity or threatens a deadline. If age, errors, and the lack of consumers increase simultaneously, the notification should group these symptoms under a possible processing degradation instead of sending one alert per metric.
For databases, prioritize connection exhaustion, sustained connection errors, prolonged locks, and query latency that translates into slow or failed routes. A costly query identified in observability is a signal for optimization; it becomes an alert when it generates a service symptom. For external APIs, measure availability, latency, error codes, quota limits, and retries. Separate recoverable failures from permanent ones and check whether a queue, cache, degraded mode, or manual procedure exists.
Attach context and classify the response
A notification should include the affected service and flow name, severity, start time and evolution, estimated scope, region or environment, metrics that triggered the rule, recently deployed version or activated change, and access to investigation dashboards. Also include safe first steps: check consumer status, validate a dependency's credentials, pause a gradual rollout, or verify errors by category.
Avoid destructive automated instructions, such as emptying a queue or restarting indiscriminately. Recovery automation must have limits, logging, reversibility, and a clear condition for escalating to human review.
- Informational: anomaly with no current impact that should be observed during business hours.
- Planned intervention: degradation that threatens a deadline but has margin and an operational alternative.
- Immediate escalation: critical operation unavailable, data risk, unrecoverable accumulation, or growing impact without known mitigation.
Avoid fatigue and review every rule
Deduplicate identical events, group alerts by probable cause, and limit repetition while the incident remains open. A secondary alert should enrich the primary one, not compete with it. If an external provider fails and causes retries, application errors, and queue delays, the central notification should describe the likely dependency and attach the correlated symptoms.
After every incident, review whether an early alert was missing, which one arrived without prompting a decision, and what evidence made it possible to identify the cause. Remove or downgrade rules that only generate routine acknowledgments. Measure the outcome qualitatively: if the recipient understands the impact and performs an appropriate first step without searching for scattered context, the rule is fulfilling its purpose.
Design example for an asynchronous flow
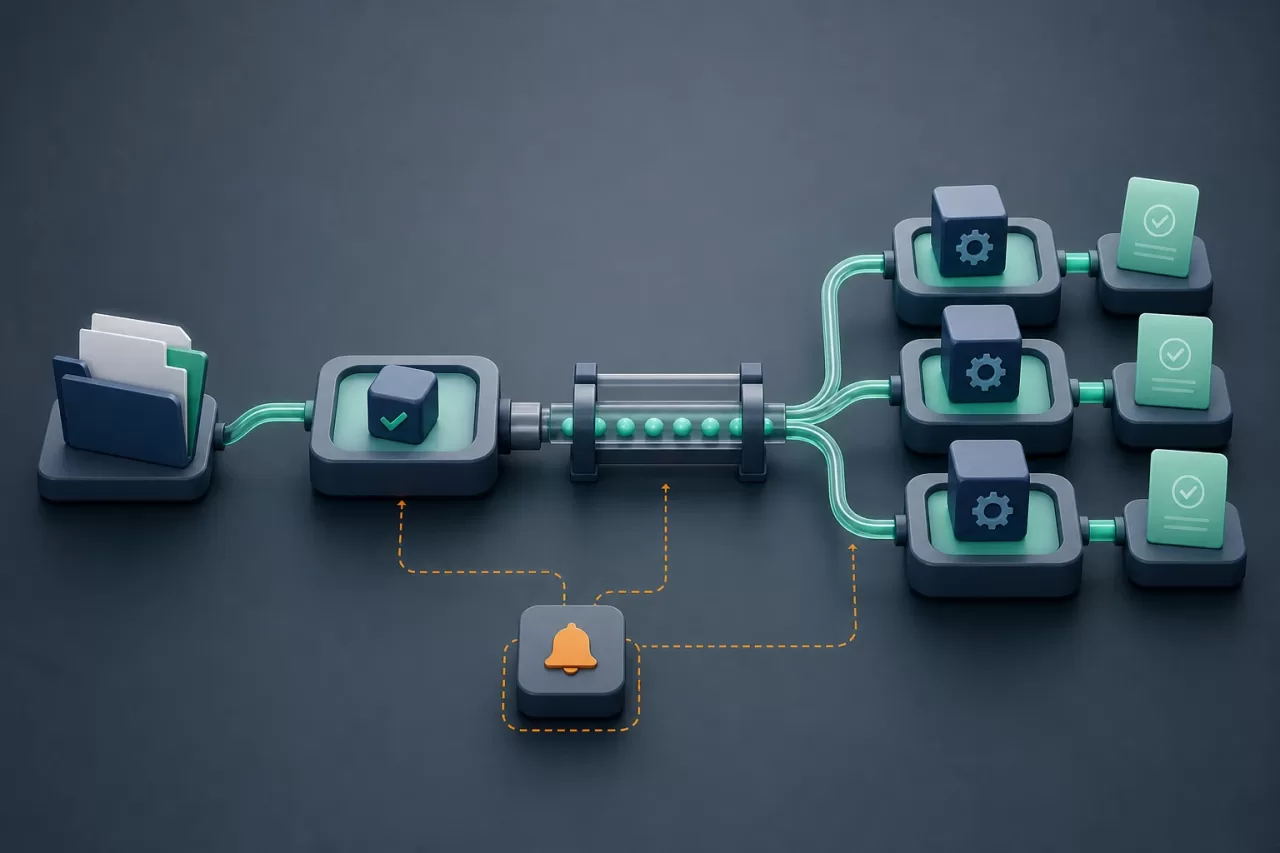
Imagine a flow for receiving, validating, and subsequently processing files. The PHP request confirms receipt after storing metadata and publishing a job. Consumers validate the content and generate a result. Alerts should not be limited to detecting that the queue contains messages.
- Availability alert if receipt fails persistently for a relevant proportion of requests.
- Delay alert if the age of the pending job exceeds the acceptable deadline for delivering the result.
- Quality alert if validation failures increase due to an internal cause, distinguishing them from invalid files submitted by users.
- Dependency alert if the required storage or API responds with sustained failures and no effective automatic recovery path exists.
Before publishing a new rule, finally verify: defined flow and owner, impact expressed in operational terms, baseline available, threshold with window and persistence, justified severity, deduplication configured, context attached, safe first step documented, and review planned. This filter turns actionable alerts for PHP applications into a decision system, not another source of interruptions.